Information Design & Illustration


Transforming complex data into clear visual storytelling
Overview
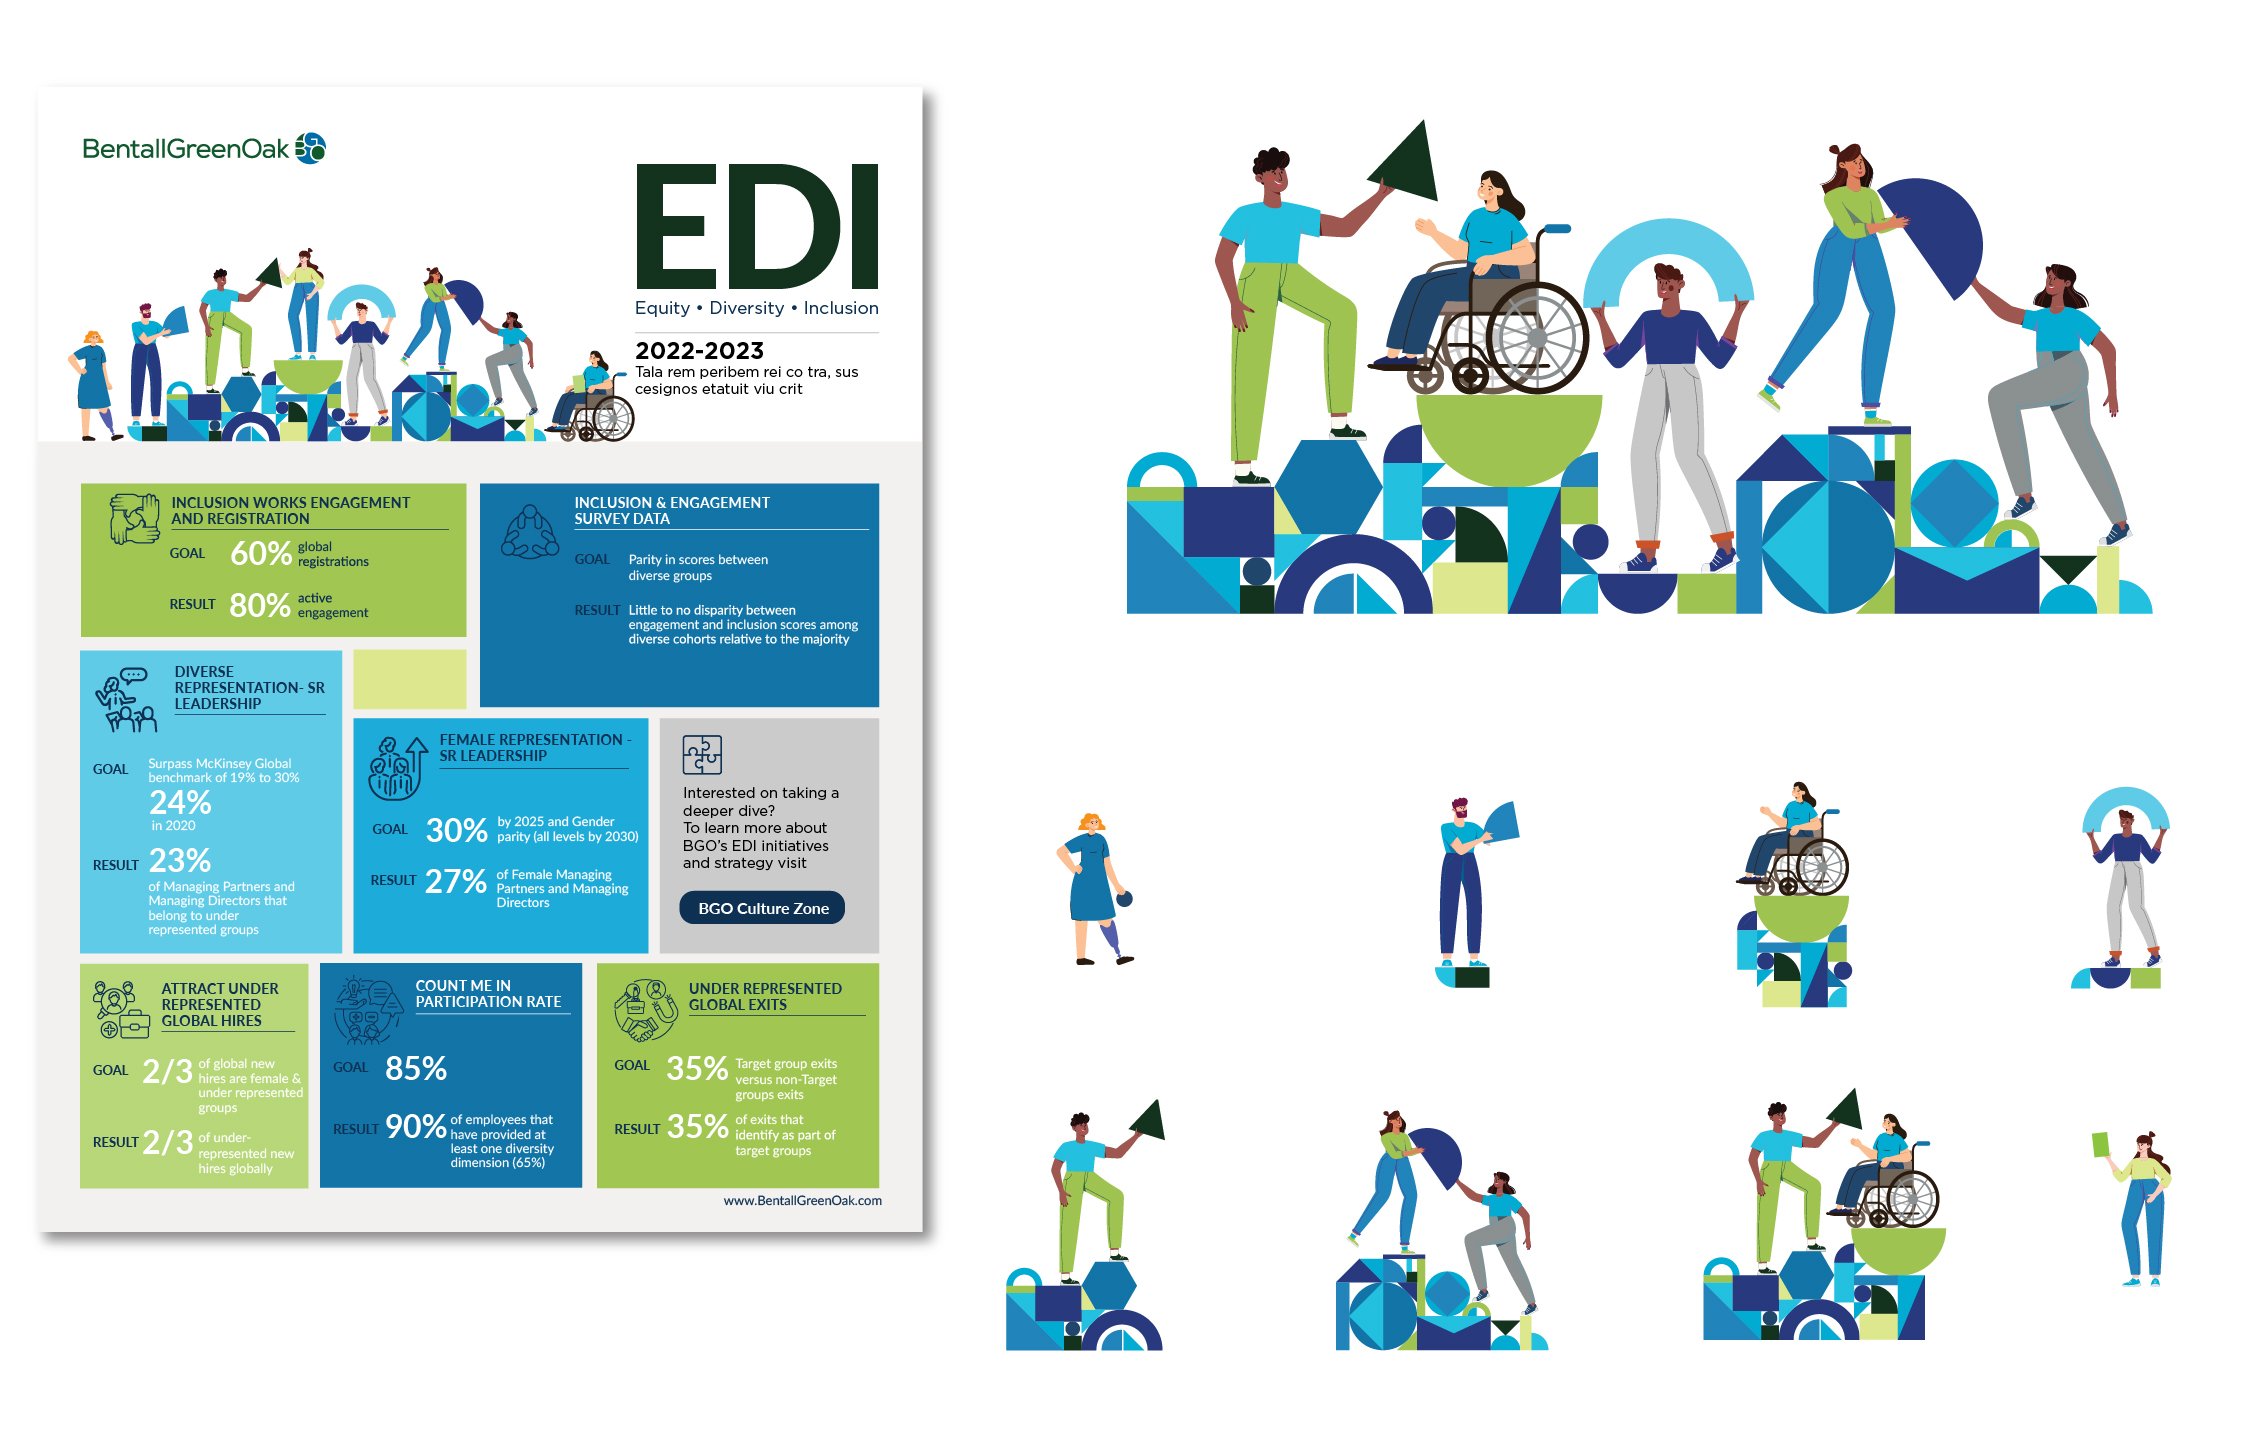
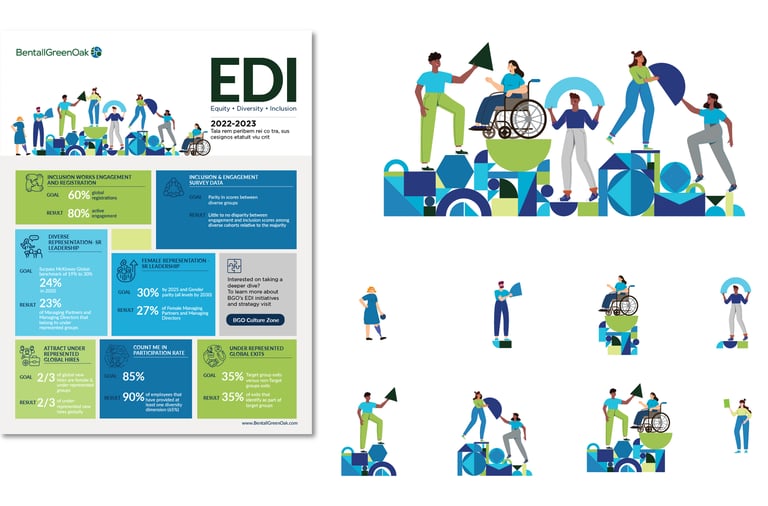
Designed custom graphics and infographics to help communicate complex business concepts across presentations, marketing materials, and corporate communications.
Role
Creative Lead
Scope
Concept Development | infographic System | Illustration
Challenge
Business and investment concepts were often communicated through dense text or spreadsheets, making it difficult for audiences understand key ideas quickly.


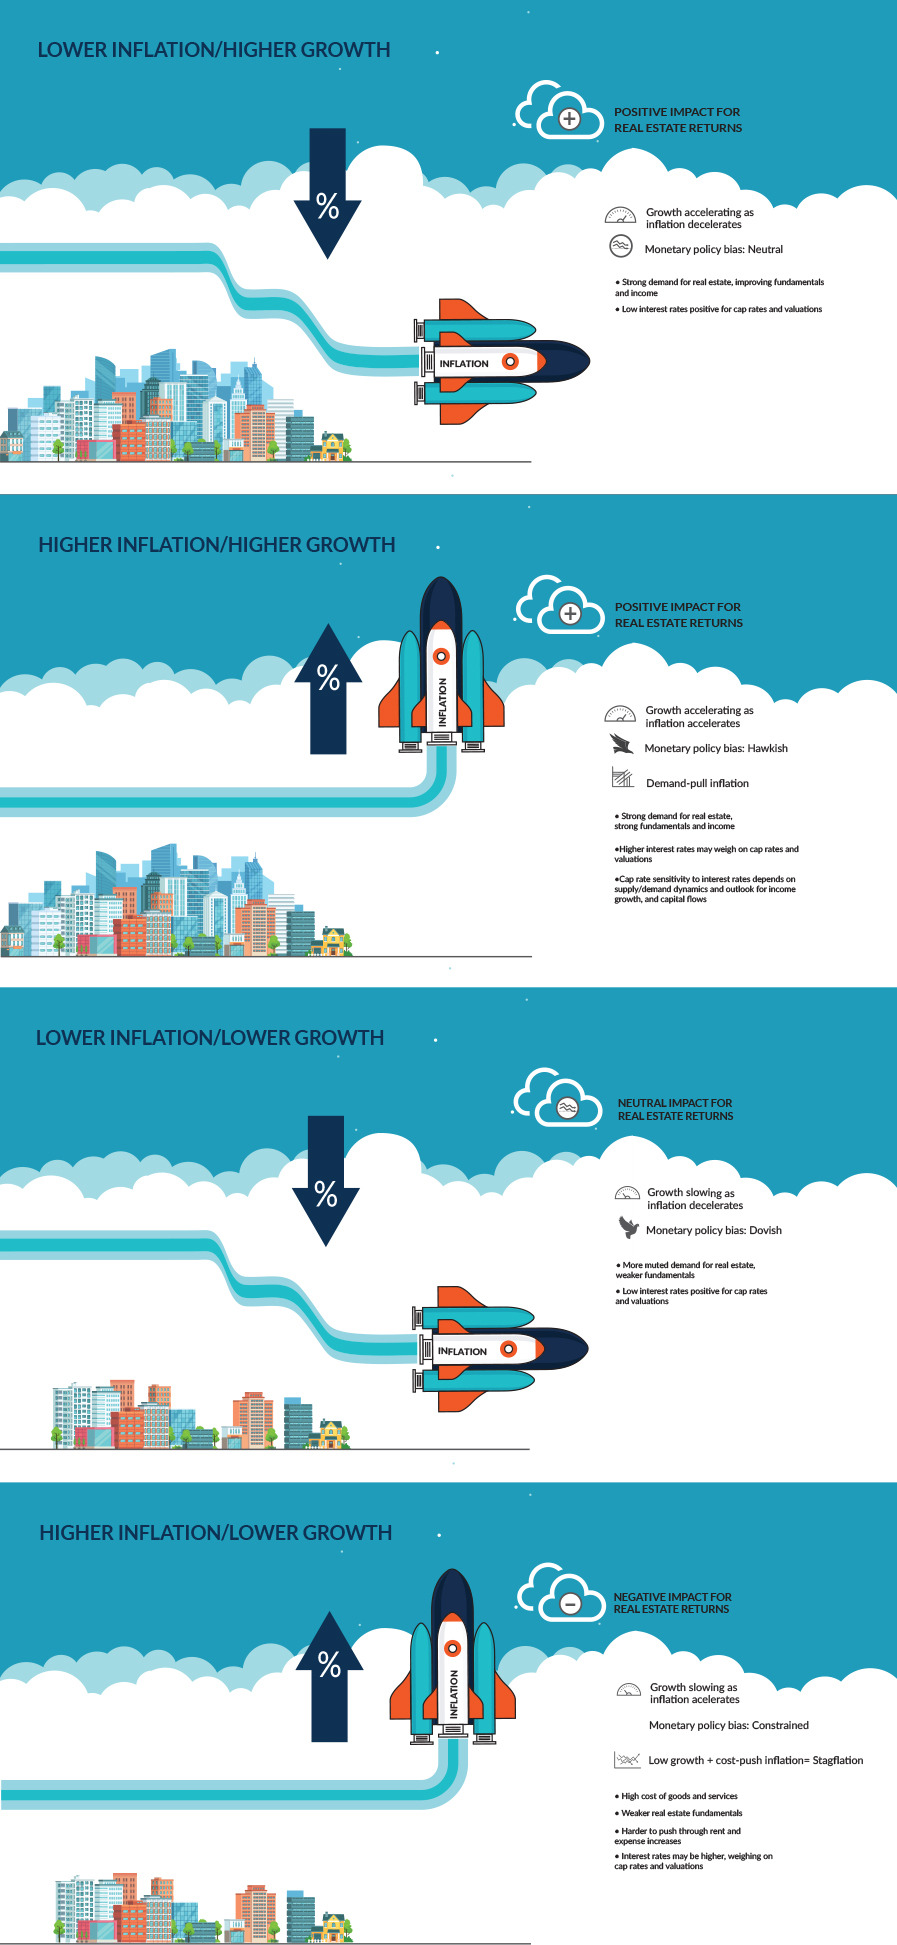
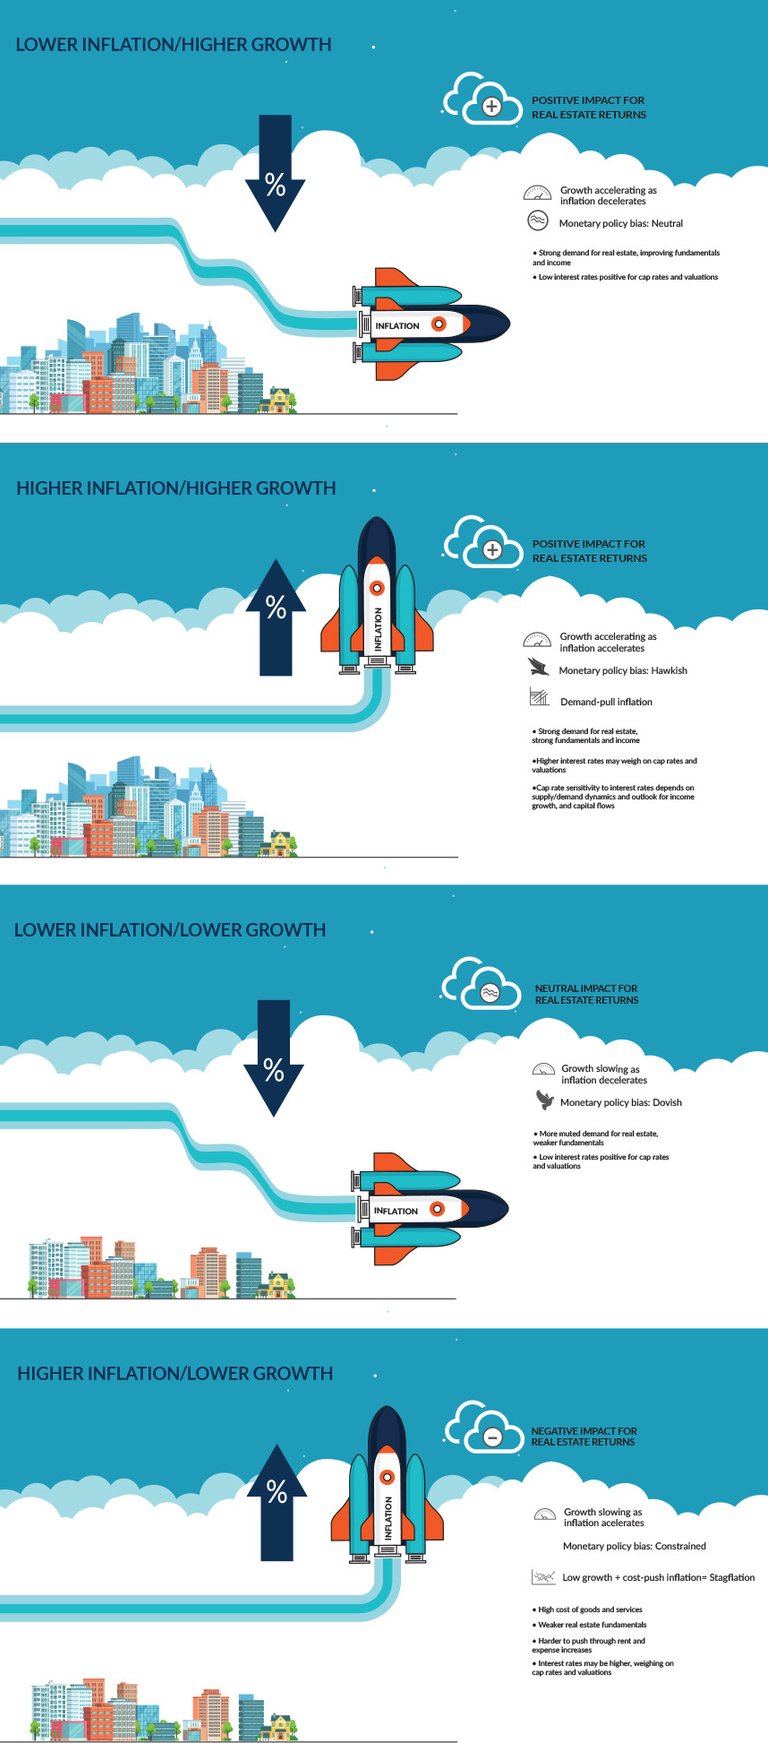
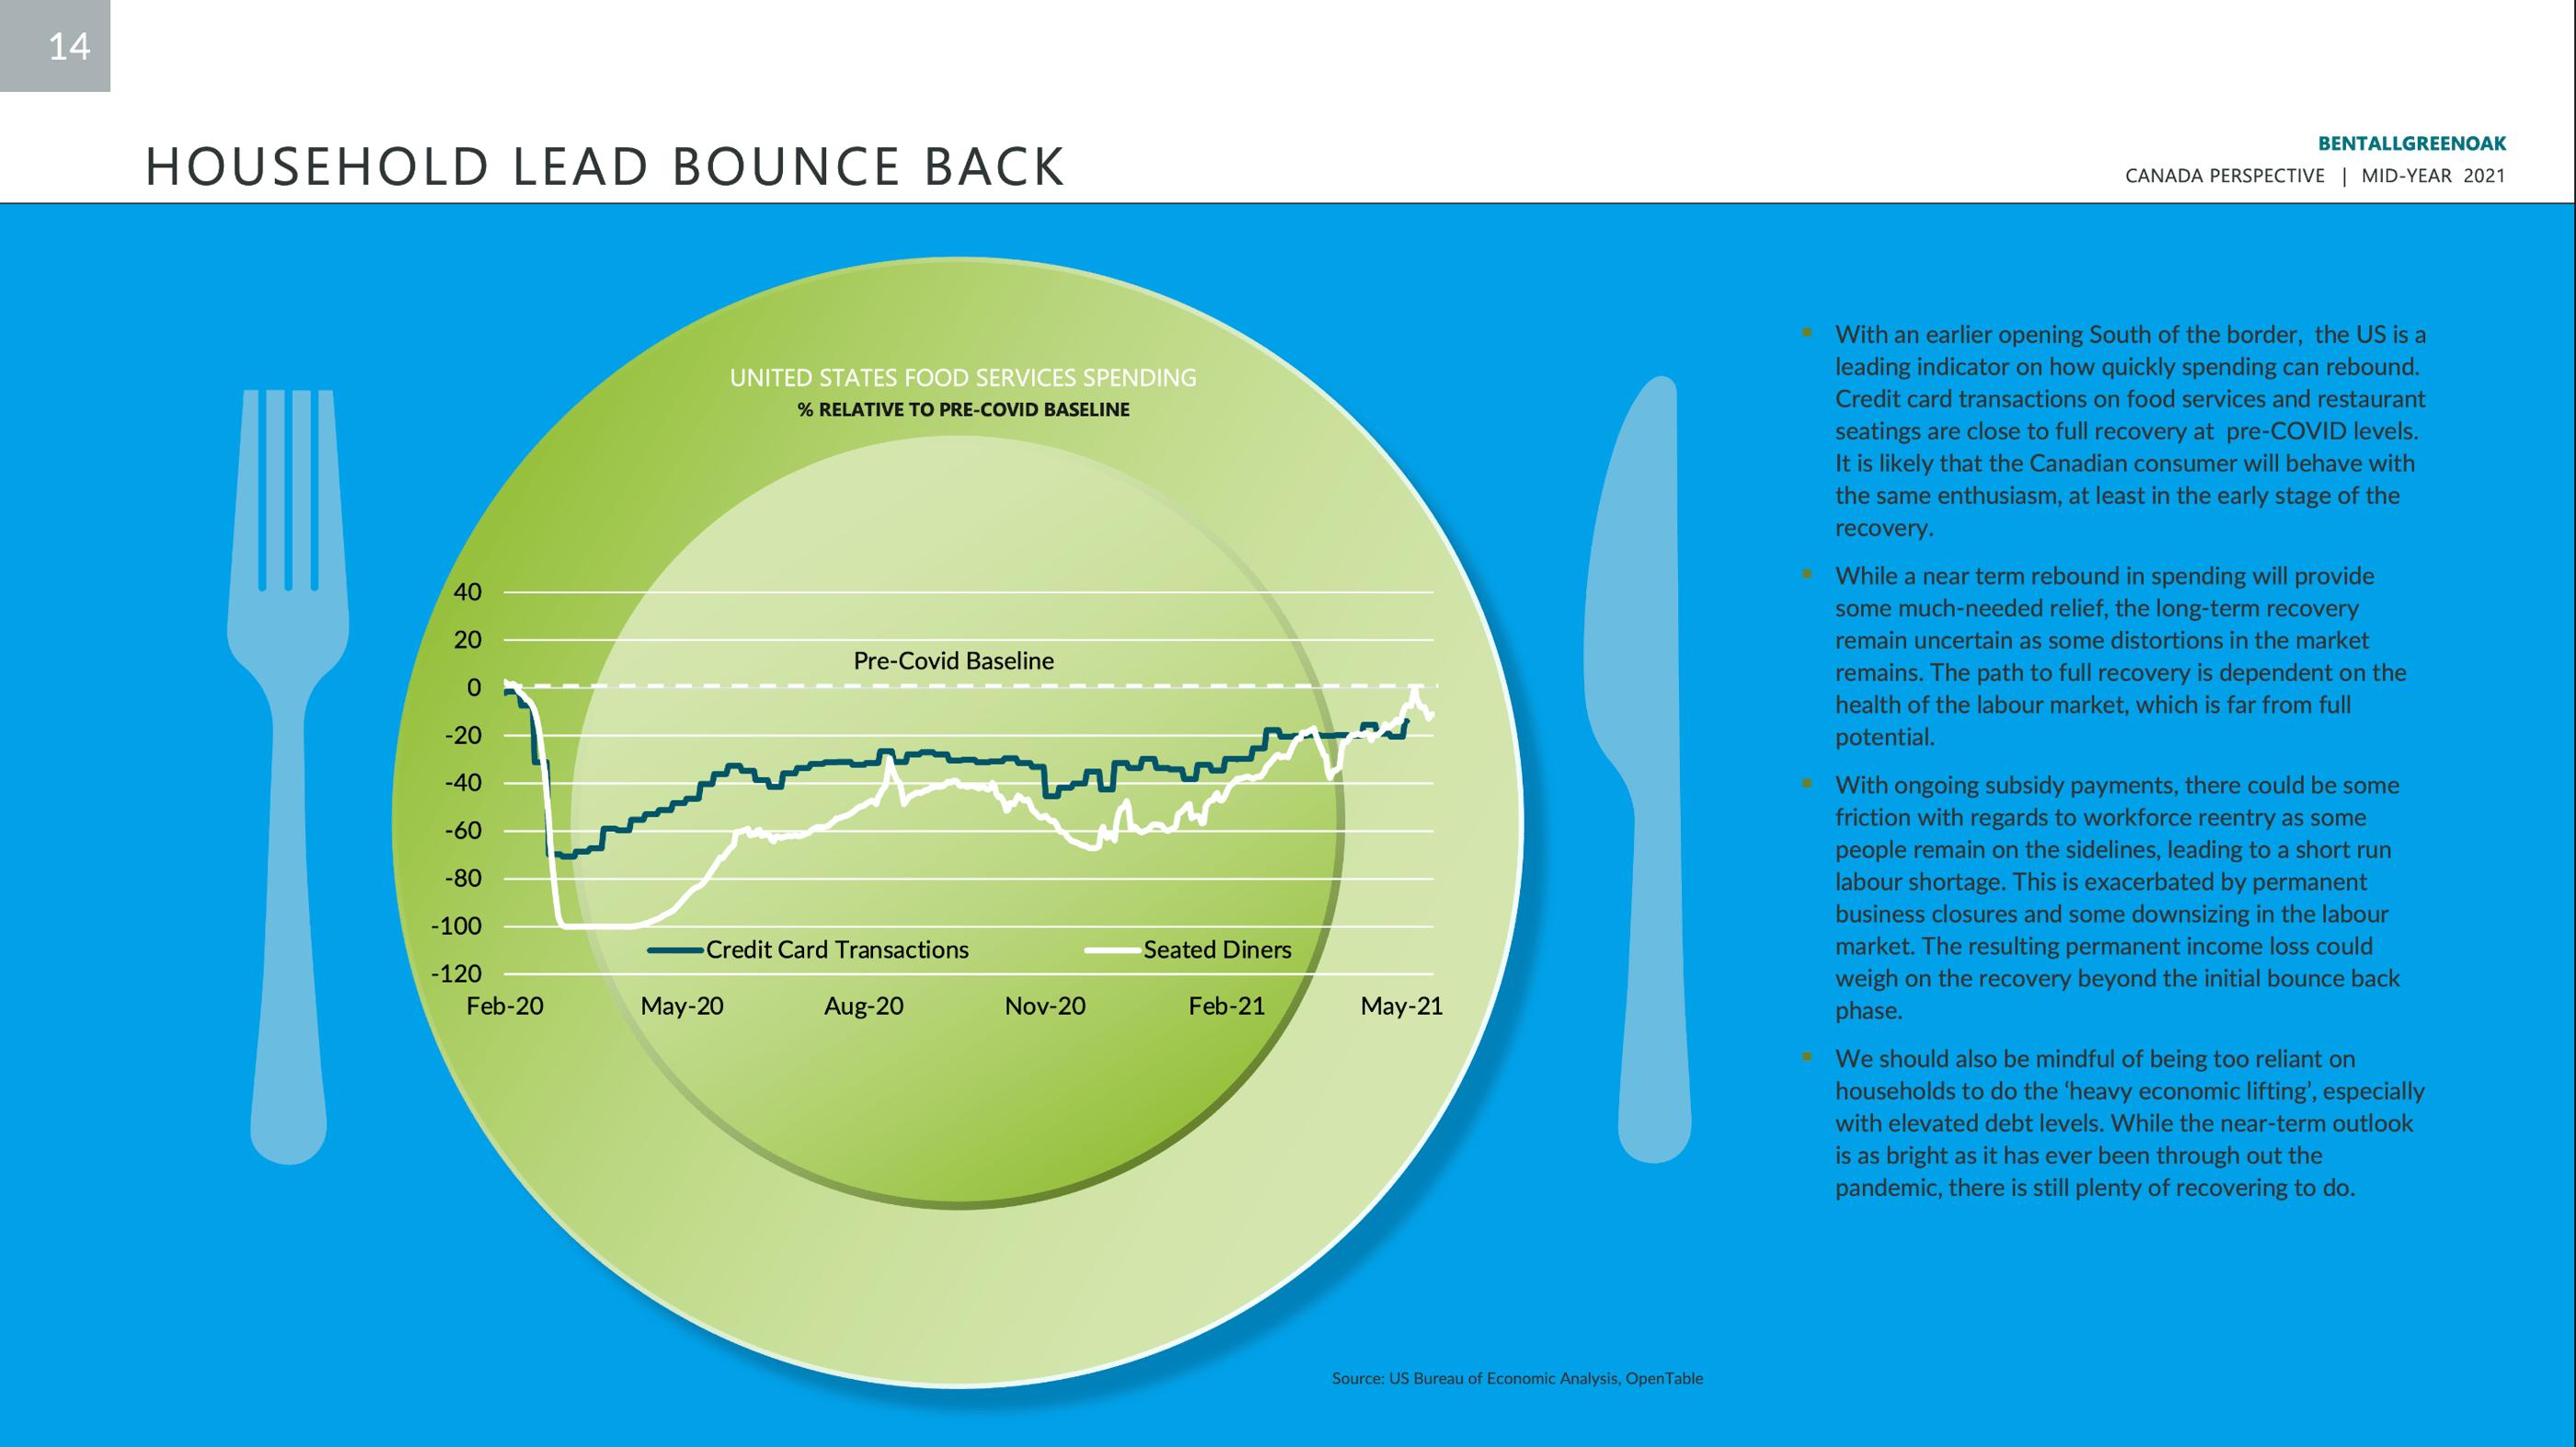
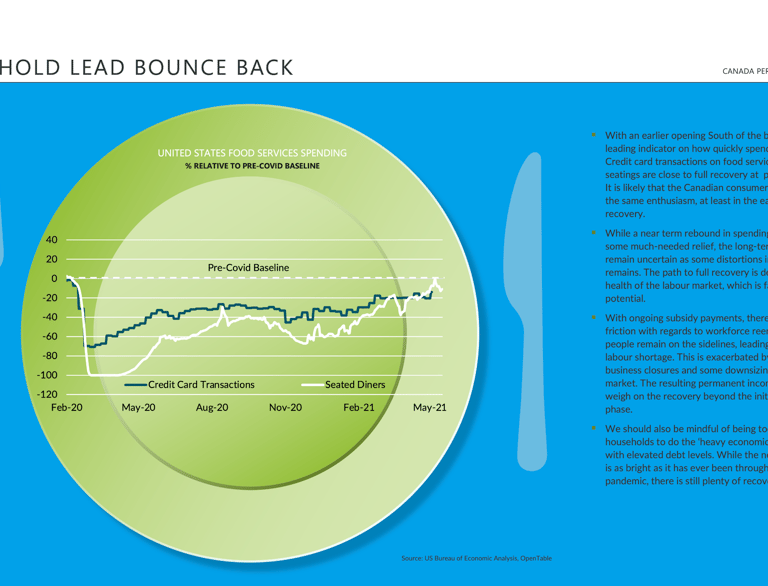
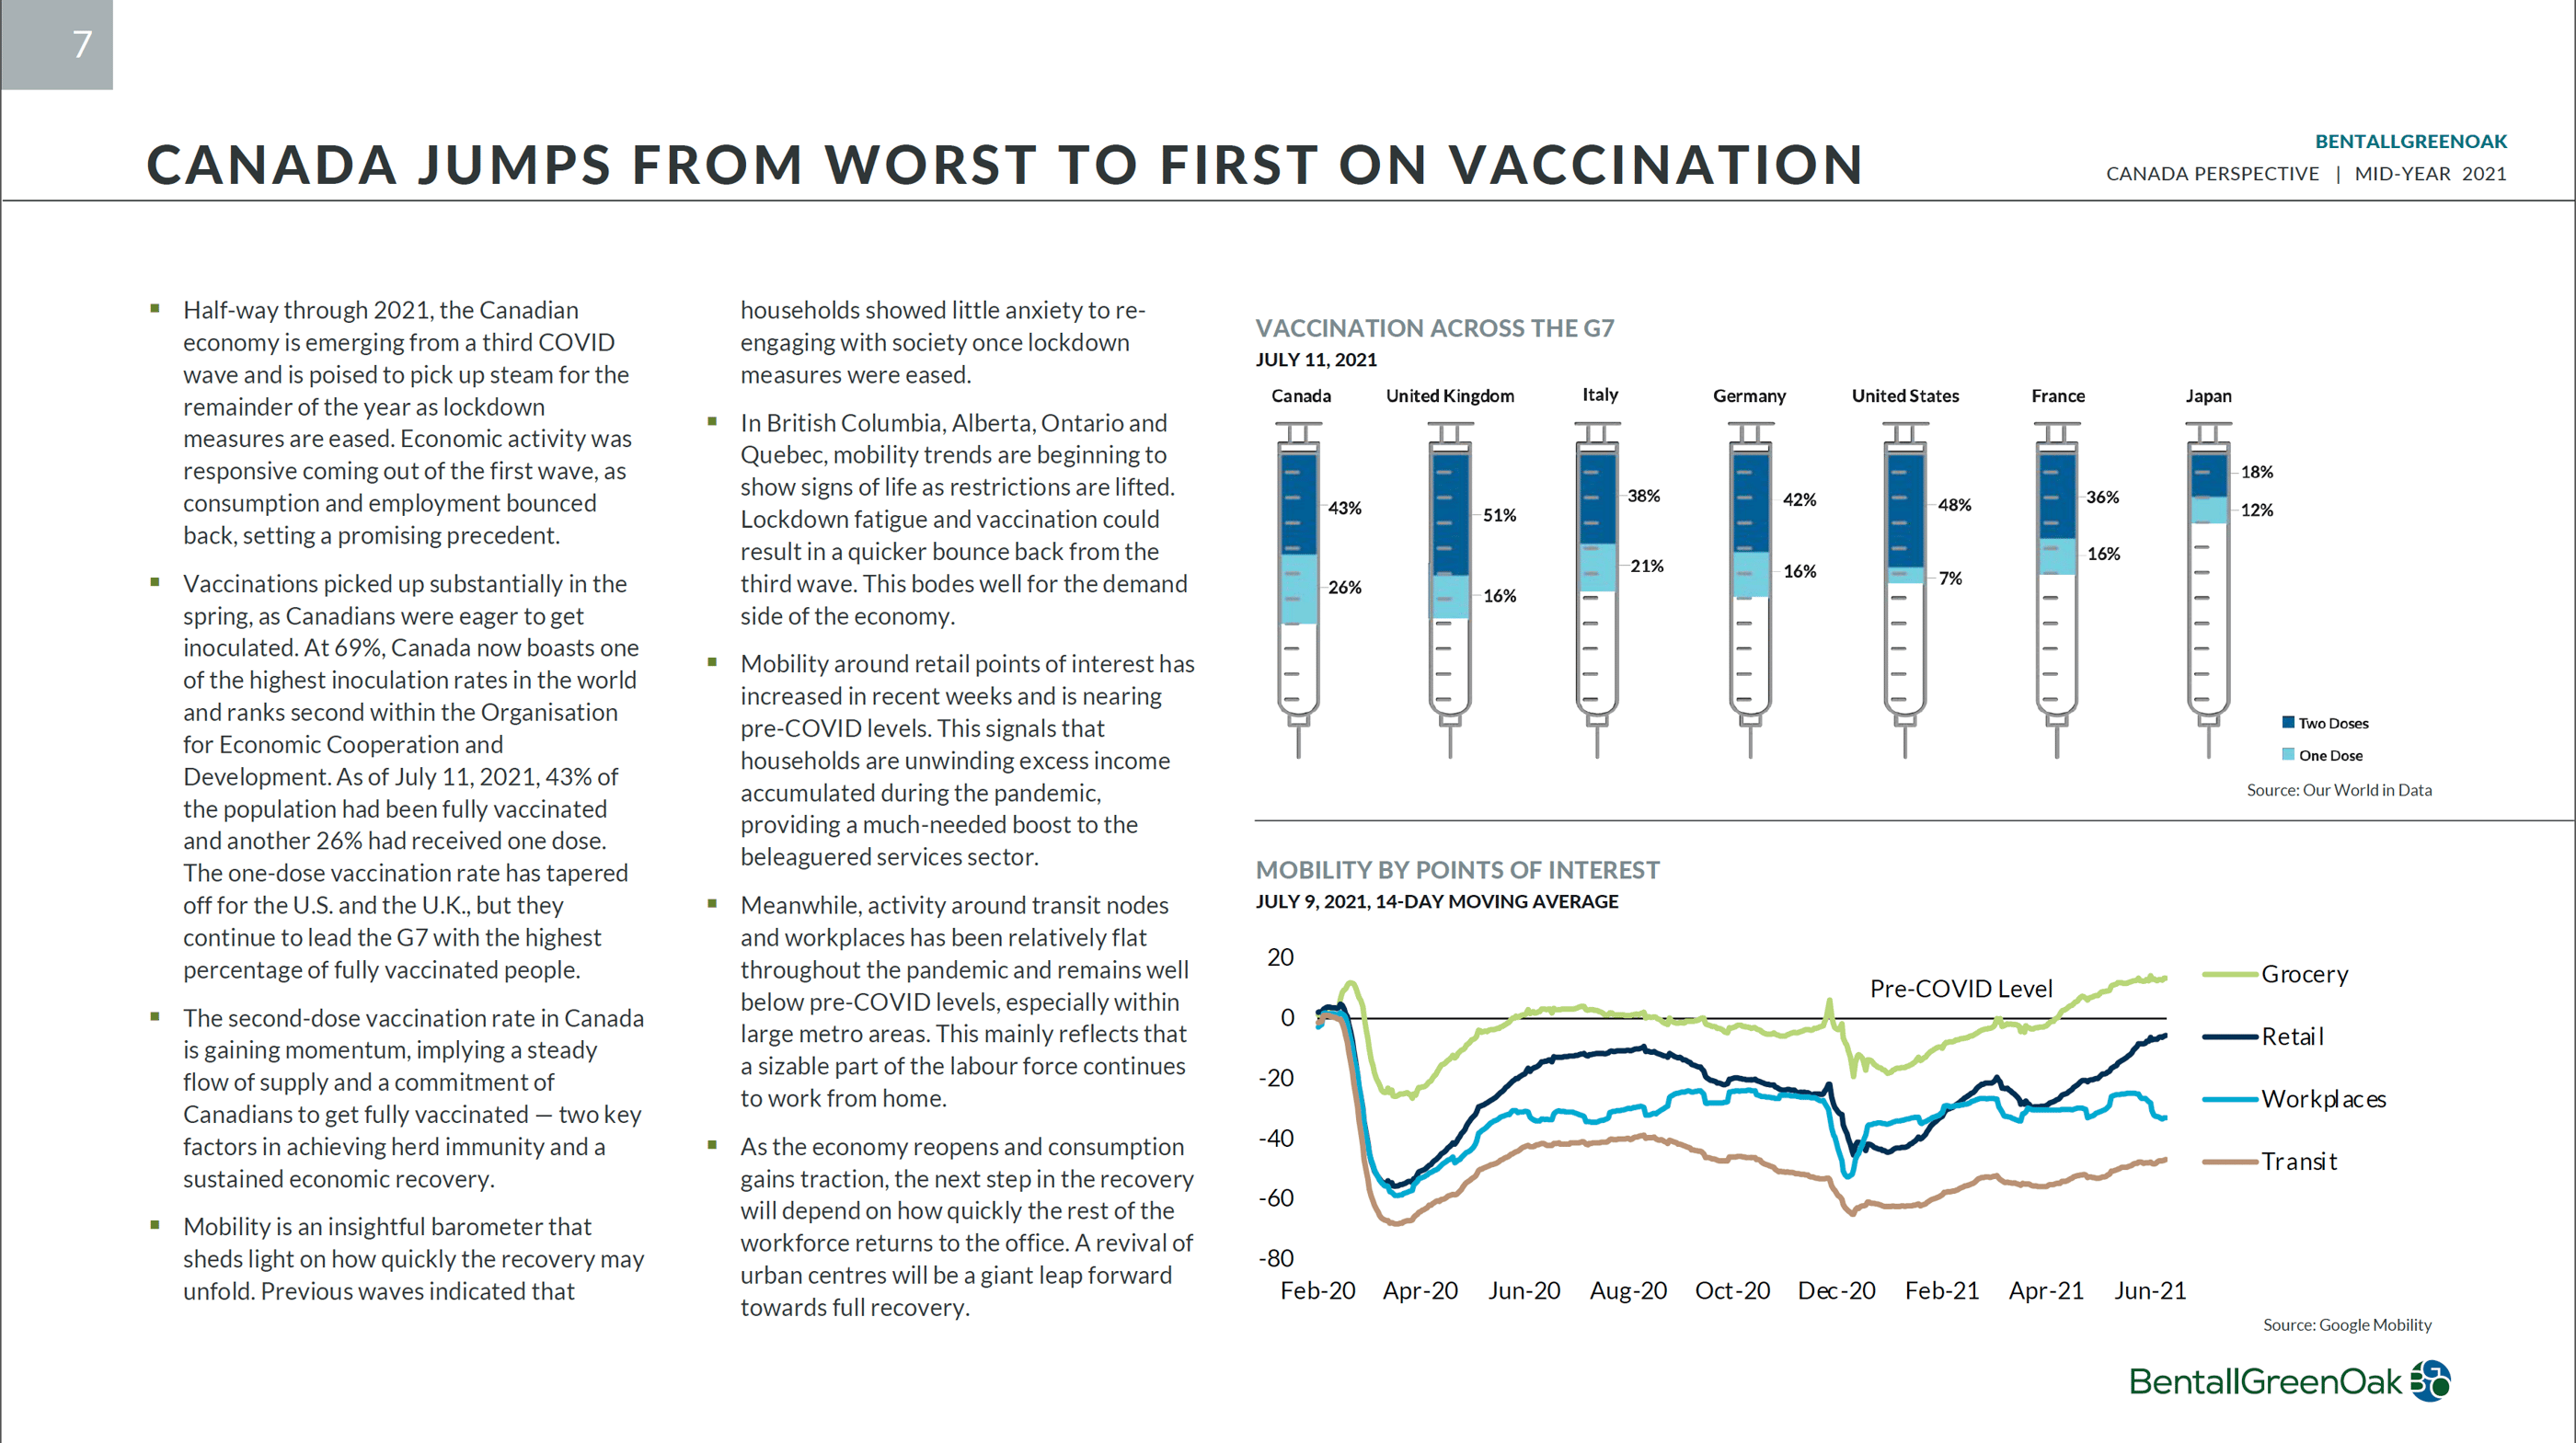
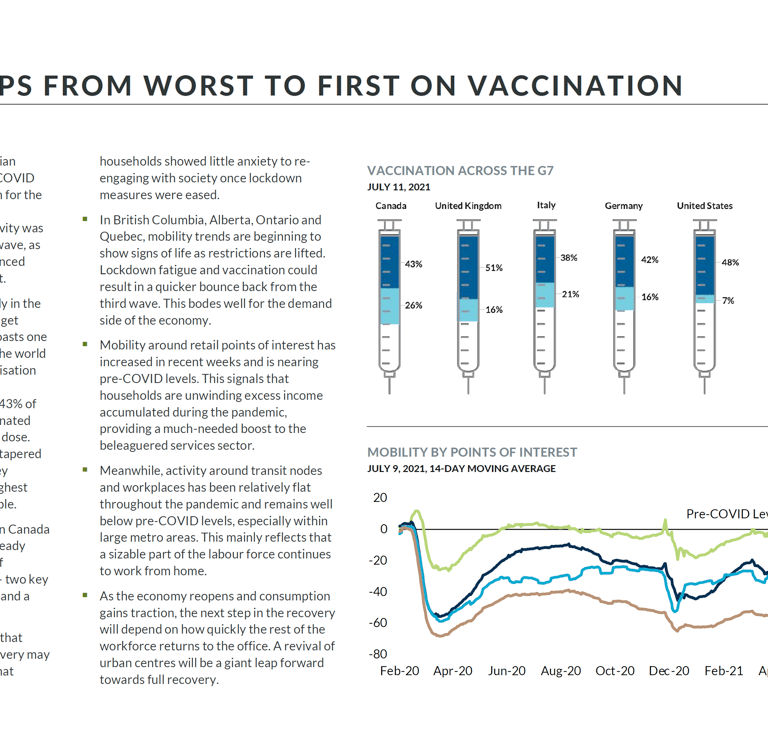
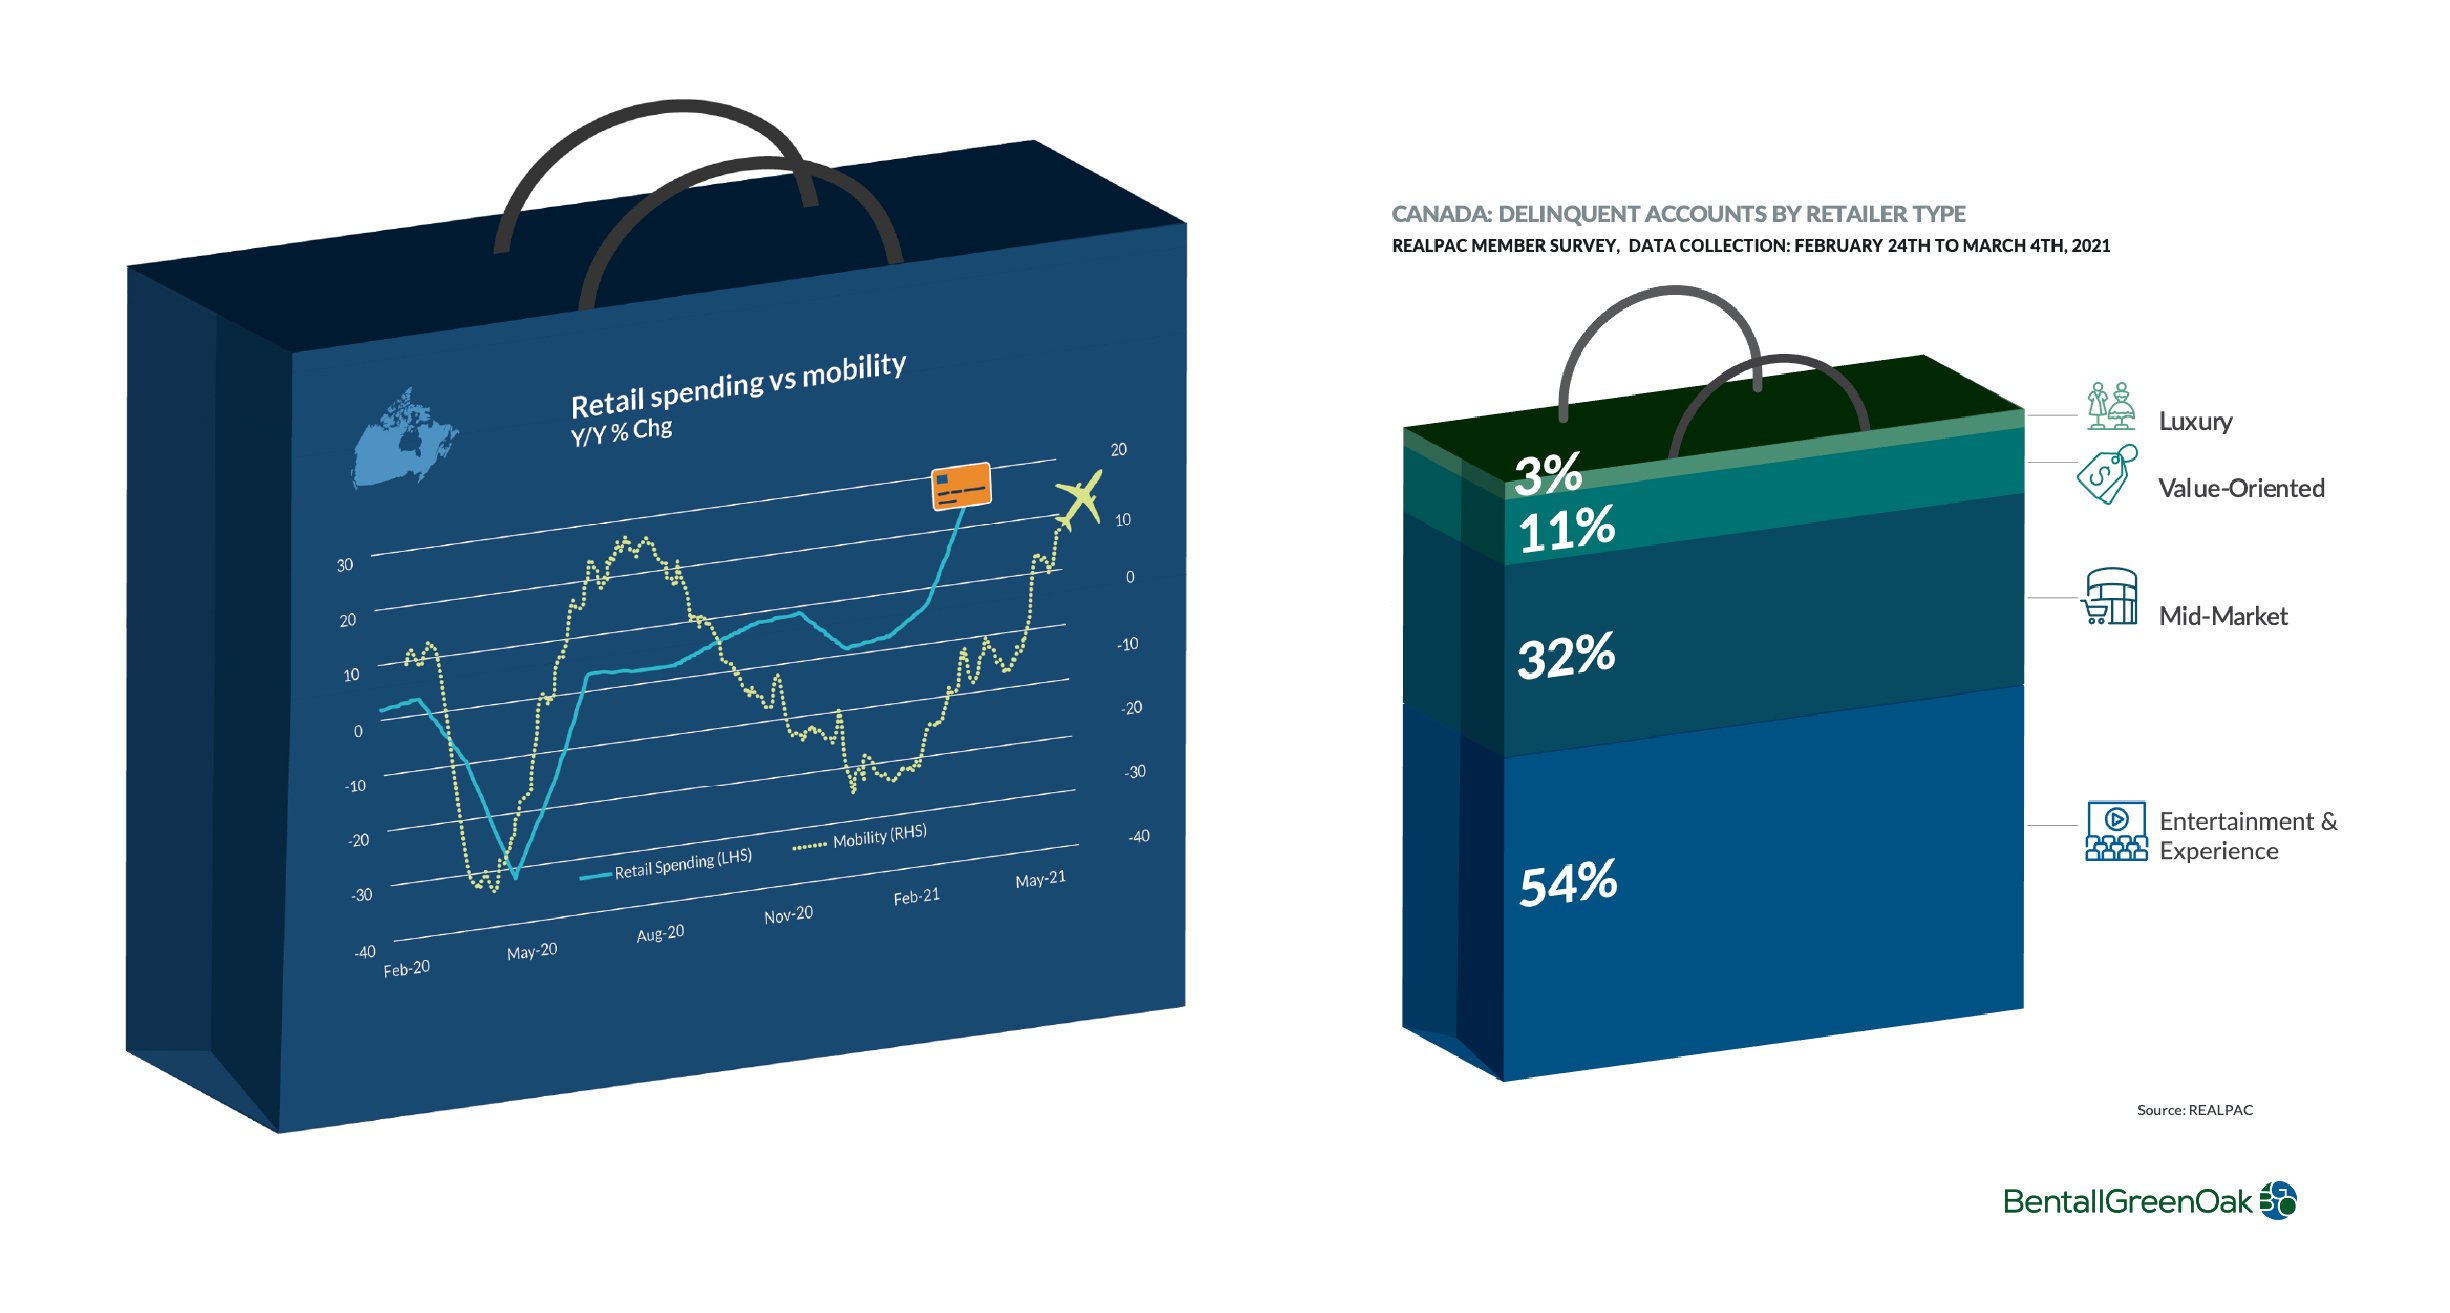
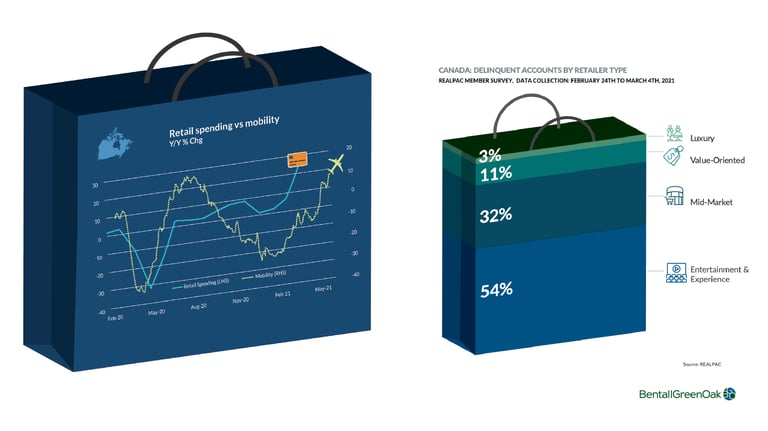
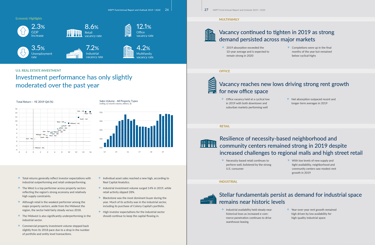
Information Graphics for Research Reports
Approach
I translated complex information into visual systems that emphasized clarity, hierarchy, and storytelling. Key initiatives included:
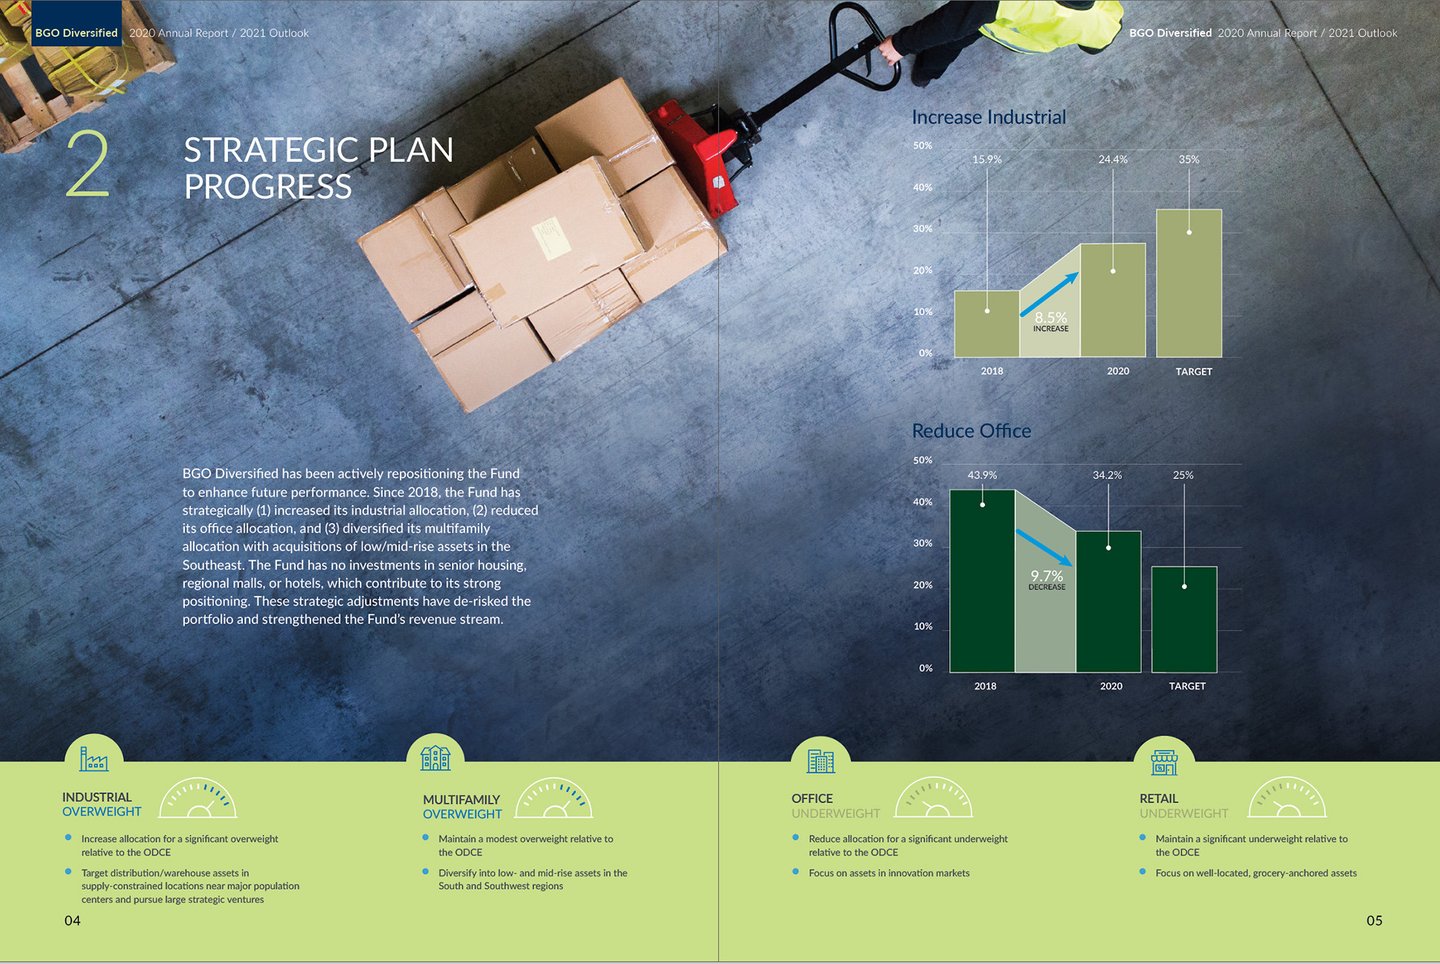
creating custom infographics to explain processes, strategies, and data
developing visual frameworks for presentations and reports
designing scalable iconography and illustration systems
ensuring visual consistency with the broader brand system


Results
The graphics improved communication clarity and helped teams deliver more engaging presentations and marketing materials. Impact included:
improved comprehension of complex information
more visually engaging investor and executive presentations
stronger brand consistency across materials

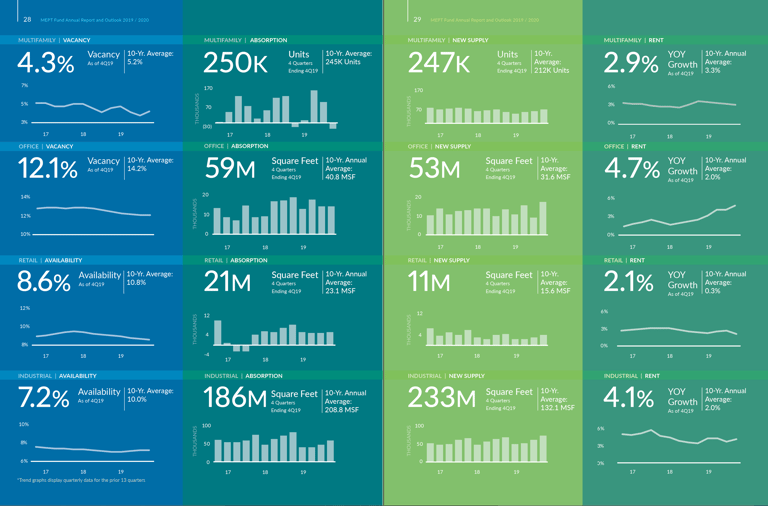
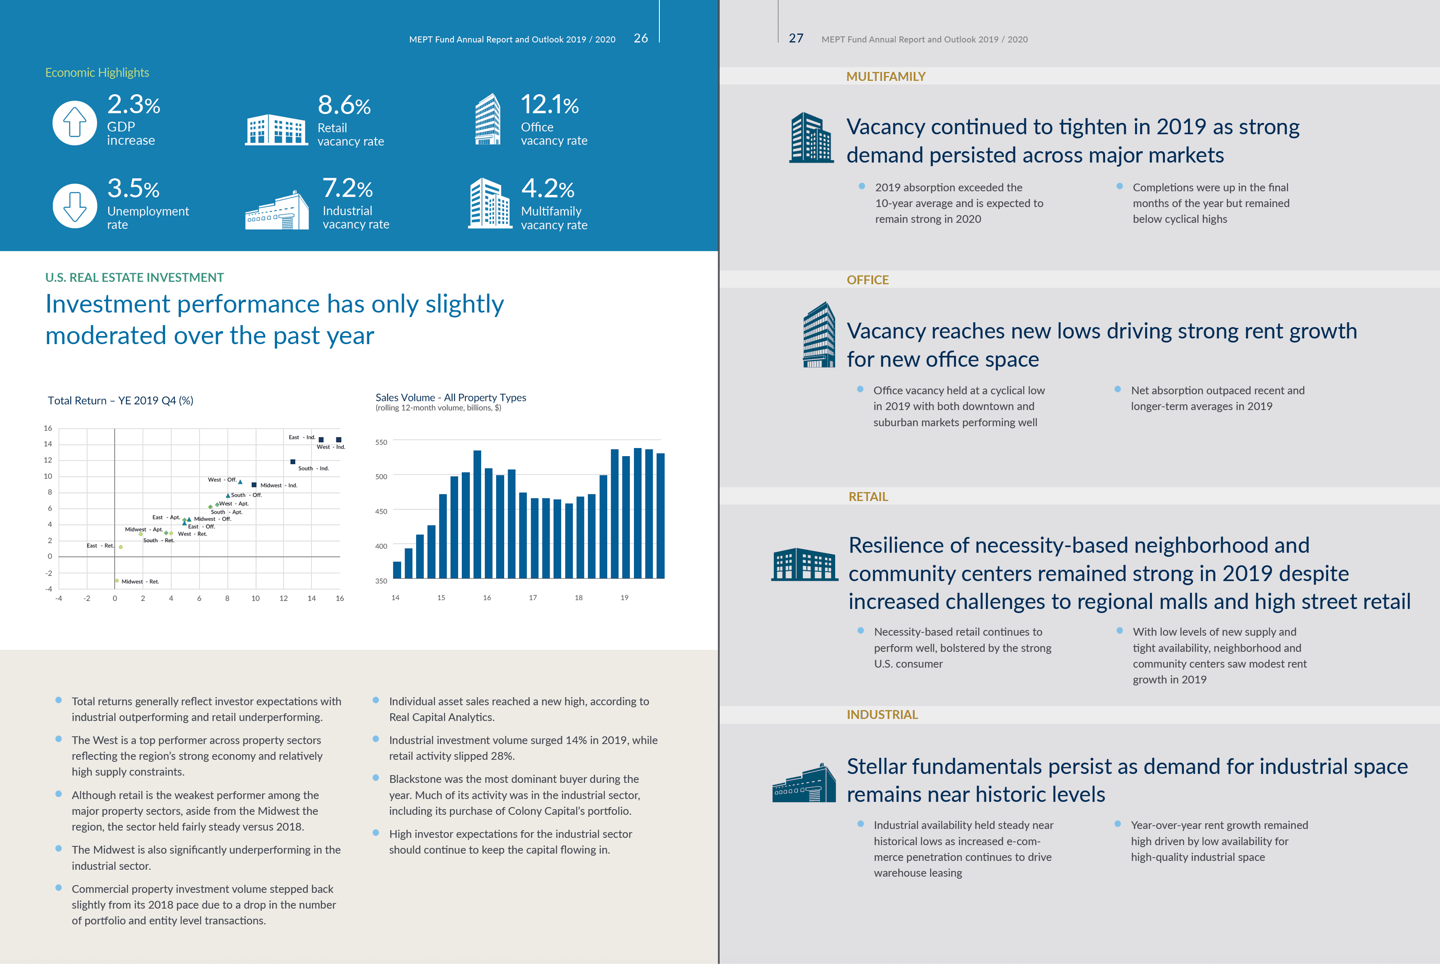
Data Dashboards